|
AISpace2 | Main Tools | News | Downloads | Prototype Tools | Customizable Applets | Practice Exercises | Help | About AIspace |
|
|
AIspace Look and Feel
Authors: Nicole Arksey and Saleema Amershi (revised by Byron Knoll)IntroductionThe AIspace tools strive to have a consistent layout and functionality to facilitate use. For example, a user who is familiar with the Neural Networks tool will hopefully be comfortable using the Decision Tree Learning tool as well. This document was created to provide an overview of common interface elements used by the AIspace tools. A Typical AIspace Tool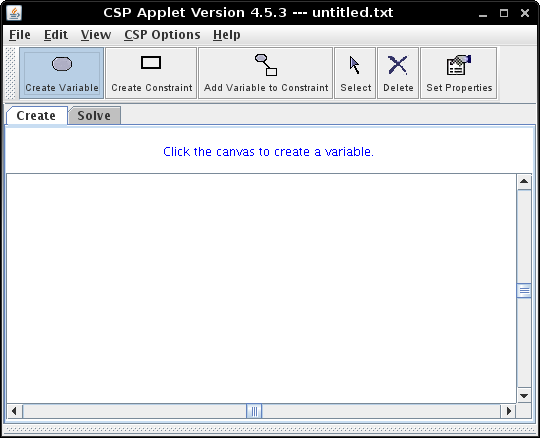
A typical AIspace tool window provides a whiteboard-like canvas, where a graphical representation of a project is displayed, a toolbar for modifying and inspecting information on the canvas, and a menu that provides options for creating and loading files, as well as changing the properties of the tool. Other panels may be added onto this basic framework as required by a specific tool. For example, the Robot tool has a controller log panel at the bottom of the window, while the Consistency Based CSP Solver tool has a domain history panel. Create and Solve mode
There are two modes which are always available in AIspace - the Create mode, and Solve mode. The user switches between them by clicking the Create and Solve tabs in the left panel. The two modes are completely independent in the sense that only the problem created in Create mode is carried over to Solve mode. Typically, functionality provided in one of the modes (for example, creating an arc between nodes in Create mode) is not duplicated in the other mode. Create mode provides functions to create a representation of a problem. Solve mode provides functions to solve and/or test a problem. It allows the user to solve the problem in one go, or step through the solution. Oftentimes, additional functionality is provided to facilitate teaching (such as additional query buttons). The Toolbar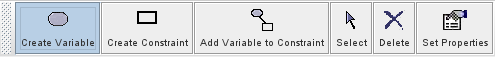
At the top of the main window is a removable toolbar which holds buttons corresponding to the mode that you are in. A button that is selected determines the functionality of the mouse pointer over the canvas, or causes some other action to occur. While hovering over a button, a tooltip will appear describing in more detail what the button does. The message panel immediately above the canvas also describes the currently selected button. 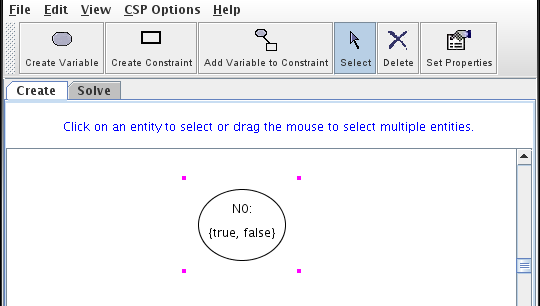
Create mode has buttons that allow the user to create a representation of a new problem (a 'project'). These include controls to create nodes, draw edges, select and delete objects ('entities'), and perform other operations on the problem components that may depend on the specific tool. Solve mode has options that enable the user to solve a problem, which varies from tool to tool. As in create mode, clicking on a button changes the function of the mouse pointer. Buttons allow the user to instruct the tool to solve the problem immediately, or step through the problem (either in whole steps with step or small incremental steps with fine step. 
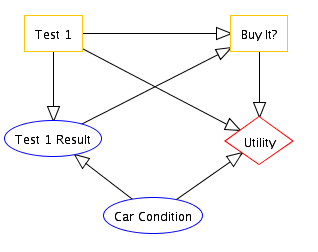
The CanvasThe main window is dominated by a 'canvas' that provides a visual representation of the problem.
This is typically in the form of a graph.
Right-clicking on the canvas will show a pop up menu which provides the same options as the toolbar.The right-click menu is dependent on the mode the user is in (whether create or solve). 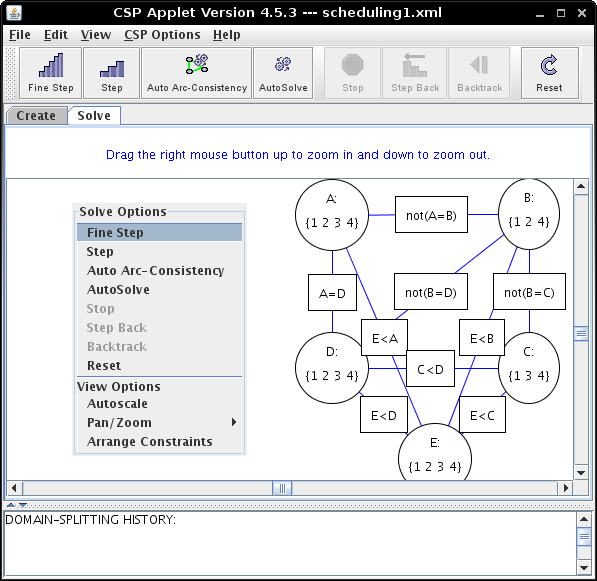
Right-clicking on a node or an edge will pop up a menu providing options for that entity. 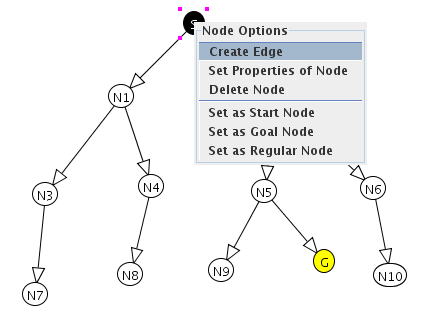
The canvas also allows the user to manipulate graphs with the mouse. To move a single entity in create mode the user can select that entity by clicking on it and then drag it to a new location. To move multiple entities at once the user should have the Select Entity button depressed and then drag a selection rectangle around the entities that he/she intends to move or left-click on entities while holding down the Ctrl button to select multiple entities. Then clicking and dragging any of the nodes will move the group of entities to a new location. In Solve mode the multiple selction/move method is also possible. As edges/arcs are intrinsically associated with nodes, moving edges are not allowed. The Message Panel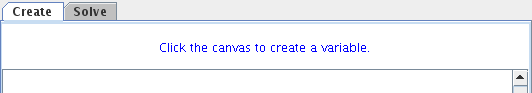
The message panel provides information about what can be done with the currently selected button, as well as other tool specific information. The Bottom Panel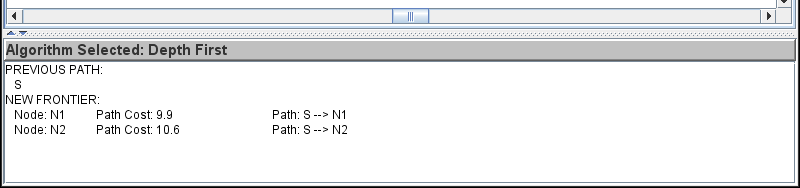
Some tools have a panel at the bottom of the main window that shows information pertaining to the current state of the graph, or to selected options. Selected options such as algorithms used in solve modes should appear in the small text area at the top of the bottom panel. Any other information pertaining to the tool or current graph will appear in a scrollable text area below this. The bottom panel can be hidden or resized using the division between it and the canvas. The Standard Menu Bar
All AIspace tools have a menu bar at the top, allowing the user to pull down menus enabling him/her to create a new project, load and modify an existing one, change global properties of the tool, select tool modes, and acquire help. Also, all tools provide at least one type of text representation of the currently loaded project. The following are the common menu options. Each tool may include other tool specific options in any of these menus. 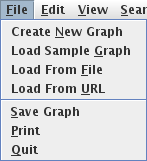
The File menu provides functions for:
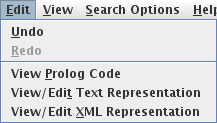
The Edit menu provides functions for:
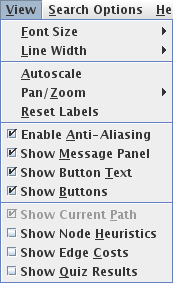
The View menu provides functions for:
Tool Specific Options menu provides functions for:
The Help menu provides options for:
On the use of colour: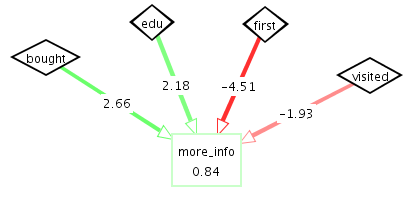
Colour is an incredibly informative tool for conveying information, and is used extensively in some of the tools - notably the Neural Networks tool, where varying shades of red and green are used to represent a continuum [-1,1]. Although this is useful, care is taken to provide other cues to accommodate colour blindness or greyscale monitors. Case in point: text is superimposed on the Neural Network edges to indicate the weights represented by the edges. |
| Main Tools: Graph Searching | Consistency for CSP | SLS for CSP | Deduction | Belief and Decision Networks | Decision Trees | Neural Networks | STRIPS to CSP |