|
AISpace2 | Main Tools | News | Downloads | Prototype Tools | Customizable Applets | Practice Exercises | Help | About AIspace |
|
|
Tutorials
Belief and Decision Networks
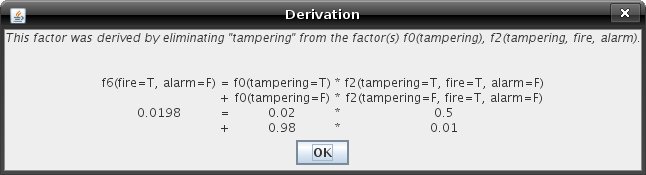
Tutorial Four: Querying a graph (Part II)Both this tutorial and the previous have used the Fire Alarm Belief Network to demonstrate the basics of querying graphs. This tutorial will cover Verbose Query Mode, and the extra information it conveys. 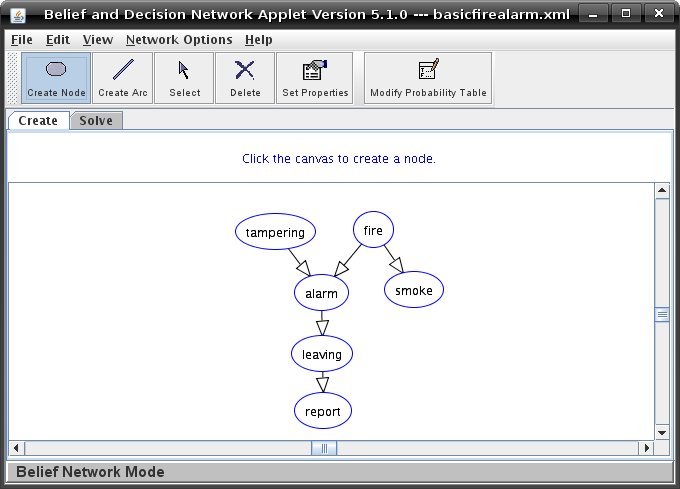 In this tutorial, we will assume that the applet is always in Verbose Query Mode. See Tutorial 3 to learn how to switch to this mode. When you query a node, a new window will open that contains a copy of the graph. The node you chose to query will now have a thick green border around it, and lines will have appeared, joining the parents of any node that are not already joined. 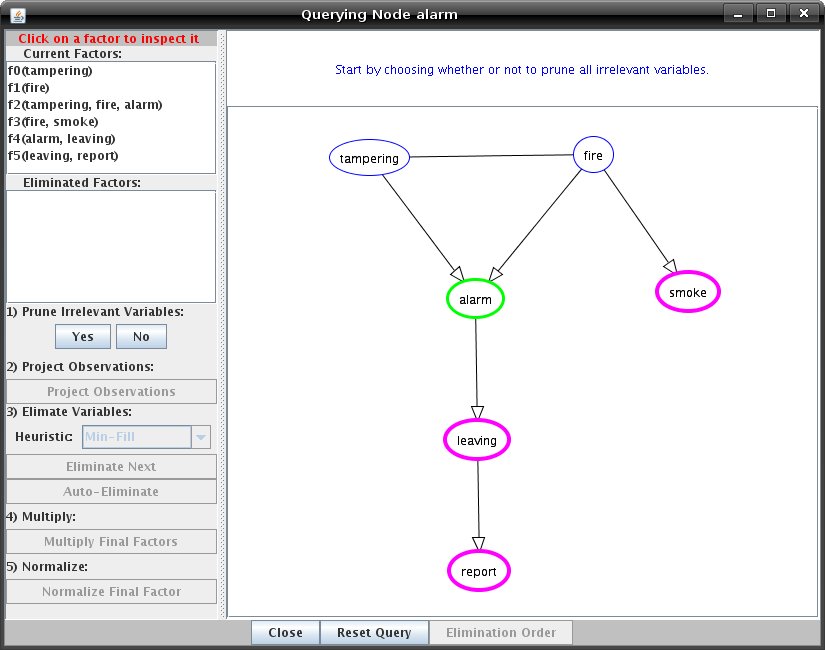 On the left hand side of the query window, you will see two lists of factors: current and eliminated. The list of eliminated factors should be blank. If you click the name of any factor, another window will open. Next to the text 'Inspecting Factor' there will be a drop-down menu with the name of the factor you chose to inspect selected. If you select another factor from that menu, the window will change and you will see the values for the new factor. On the right hand side of this window will be a series of buttons, directly underneath the word 'Value'. Click on any one of those buttons to open a derivation dialog which shows how the value was calculated. These windows can be closed by clicking 'OK'. When you have finished inspecting the factors, return to the query window. 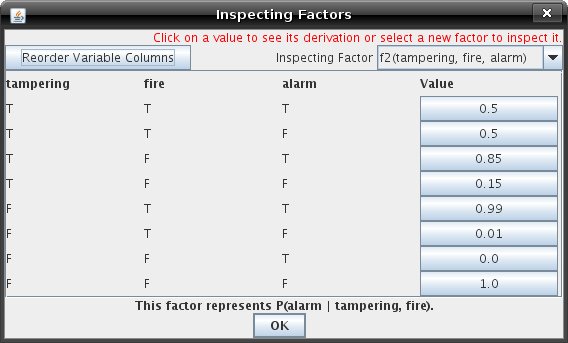 Here is an example of a derivation dialog acquired later in the elimination process:
There are five stages in the process of completing a query: 1) pruning irrelevant variables, 2) projecting observations, 3) eliminating variables, 4) multiplying final factors, and 5) normalizing final factors. These stages must be completed in order, although stages will be automatically skipped under certain conditions (for example, if there are no observations step two will automatically be skipped). These stages are listed on the left panel of the query window, and your current progress through the stages can be determined by the state of the buttons under each stage description. It is possible to advance through the stages either by using the buttons on the left panel, or by directly interacting with the graph. You can interact with the graph by right clicking on the canvas and selecting an action, or by left clicking on nodes. Left clicking on a node has different behavior depending on the stage that you are in. For example, clicking on an observed node while you are in the "Project Observations" stage will project the nodes observation. You can rearrange the graph to make it easier to read by dragging nodes and using the autoscale option (right click on the canvas and select "Autoscale"). To improve the efficiency of your query, you can prune irrelevant variables from the graph. If you press the "Yes" button in the "Prune Irrelevant Variables" stage, any variables that do not affect the probability of the query node will be pruned, and treated as having been eliminated. The irrelevant variables are chosen according to the definition of conditional independence. An algorithm that implements the criteria for d-separation is used. During the "Eliminate Variables" stage, there are two ways in which you can choose variables to eliminate. The 'Auto-Eliminate' button will eliminate all the variables in the order specified by the heuristic which is specified by the drop down menu next to 'Heuristic:'. The available heuristics are 'Max-Cardinality', 'Min-Degree', 'Min-Factor', 'Min-Fill', 'Random', and 'Sequential'. The 'Eliminate Next' button will eliminate a single variable each time you press it. The second way to choose variables to eliminate is by clicking on them directly. When you eliminate a variable, it will be greyed out, and the lists of current and eliminated factors will be updated accordingly. You should see a new factor at the bottom of the 'Current Factors' list, and the variables in that new factor should all be joined if they weren't already. Once all the variables have been eliminated, the only factor remaining will be the answer. A window will also open up giving you the query results. This is the same window you would get if you were querying the node in Brief Query Mode. 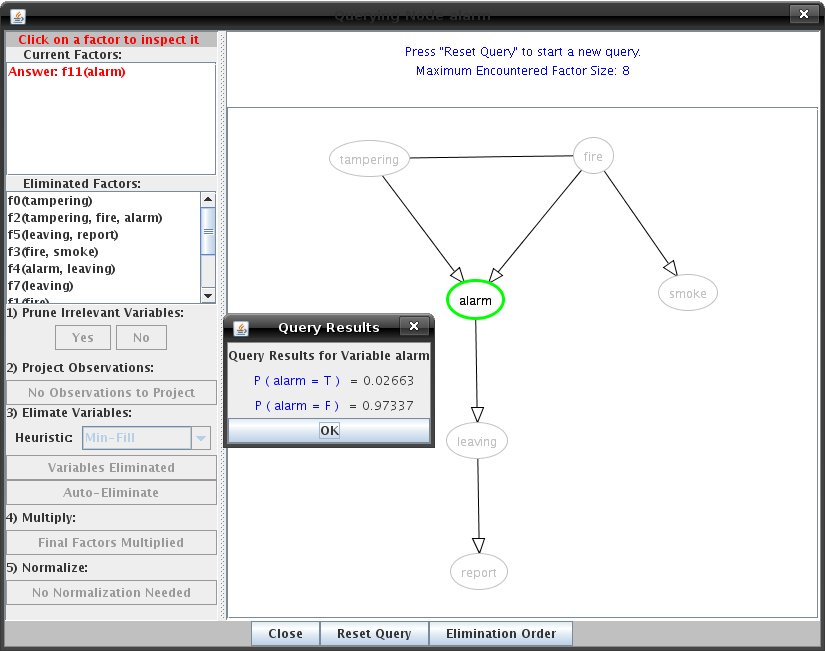 You have now covered the basics of graph creation and querying. For more information about d-separation and the conditional independence quiz, continue to the next tutorial. |
| Main Tools: Graph Searching | Consistency for CSP | SLS for CSP | Deduction | Belief and Decision Networks | Decision Trees | Neural Networks | STRIPS to CSP |