|
AISpace2 | Main Tools | News | Downloads | Prototype Tools | Customizable Applets | Practice Exercises | Help | About AIspace |
|
|
Tutorials
Stochastic Local Search Based CSP Solver
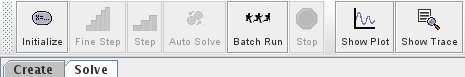
Tutorial 3: Solving A CSP by SearchingOnce you're done building a Constraint Satisfaction Problem (CSP) in the applet (see Tutorial 1), you can begin searching for a solution by switching to 'Solve' mode. Click on the 'Solve' tab above the main white canvas to do this. The toolbar buttons will change to give you solving options. Some menu items which were previously unavailable in 'Create' mode are now enabled. Also, the selected algorithm name is visible below the canvas. The solve toolbar will initially look like the toolbar below:
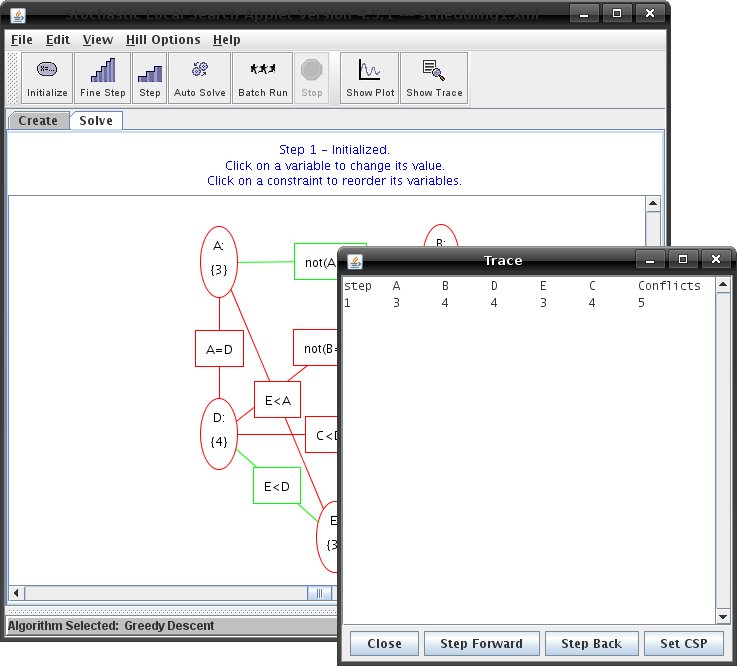
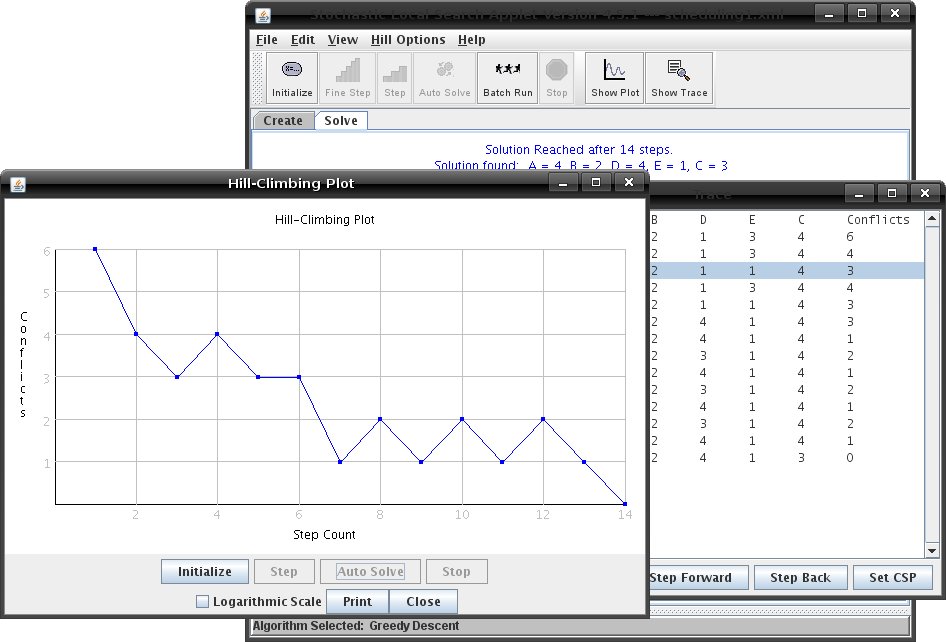
To begin searching for a solution, you must first initialize the CSP by clicking the 'Initialize' button. This will assign a value to each variable in the CSP, from its domain, randomly or by lowest value. The initialization method can be set in the 'Algorithm Options' dialog under the 'Hill Options' menu. See Tutorial 4 for more details about this and other 'Algorithm Options'. Each variable in the CSP now has one value assigned to it. Also, some arcs appear green and some arcs appear red. Red arcs mean a constraint between variables is not met with the given variable value assignment. Green arcs mean the constraint is consistent. As you search for a solution, and variable assignments change, so will the colors of arcs. When you initialize the CSP, a "Trace" window will appear showing the initial variable-value assignment and the number of conflicts for that assignment. This window will always correspond to the CSP in the main applet window, even as you step or solve.
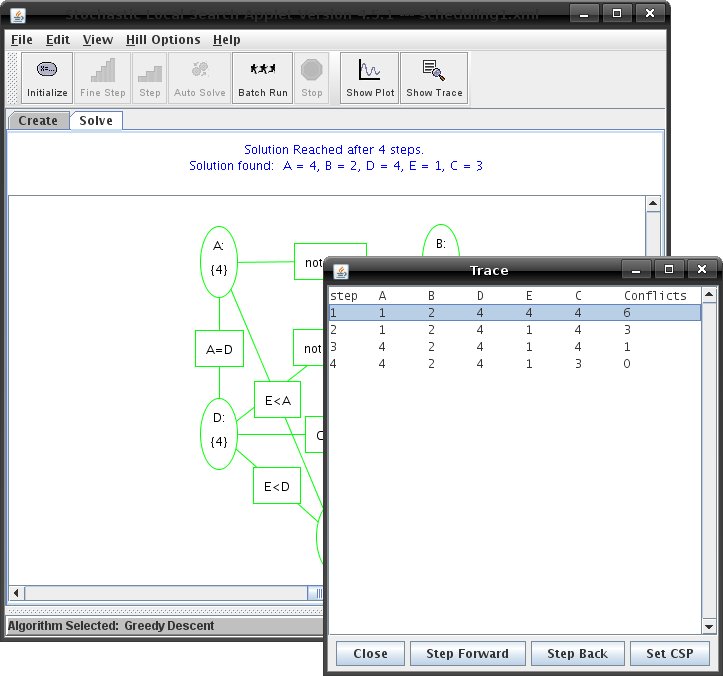
Now that the CSP has been initialized, you can begin searching for a solution. You can 'Step' through the search manually, by clicking the 'Step' button. This will let the applet pick a variable or value to change in the CSP according to the search algorithm you selected. With some algorithms, you can also 'Fine Step' through the search. In these cases, one 'step' is equal to two 'fine steps'. If you get tired of clicking the 'Step' or 'Fine Step' button, you can use the 'Auto Solve' button to let the applet step continually, according to the specified algorithm, until a solution is found or until the predefined number of steps have been completed. If a solution is found, the message canvas will display the value assignments that solve the CSP. Recall that a solution means that there is a unique value for each variable such that all the constraints are satisfied. If there is a solution there should be zero conflicts left in the 'Trace' window.
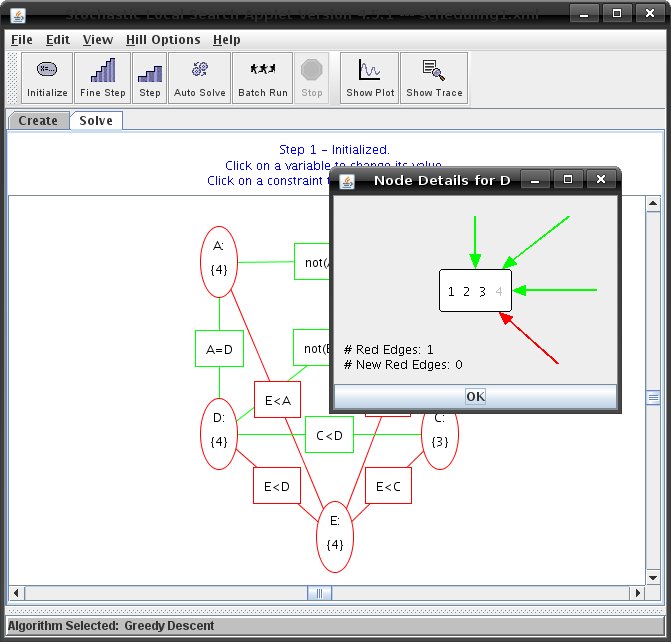
The number of steps to stop solving at can be specified in the 'Algorithm Options' dialog under the 'Hill Options' menu. The default termination number is 100 steps. You can also manually stop the applet as it searches for a solution by clicking on the 'Stop' button. You may then resume solving by any of the methods mentioned above. As you search for a solution, the 'Trace' window will trace the steps and variable assignments. You also have the option of stepping back through the trace by clicking on the 'Step Back' button in the 'Trace' window. And if you click on a specific assignment (a row in the 'Trace' window), you can set the CSP back to that assignment by then clicking on the 'Set CSP' button. The graphical display of the CSP will update to correspond to the current assignment in the 'Trace' window. This may be useful if you want to look at a certain assignment in more detail, or if you want to make your own change to the CSP after a certain assignment. You can manually change a variable's value by clicking on the variable in the CSP and then clicking on a value from the possible domain values for that variable that appear in the 'Node Details' dialog box that comes up. As you hover over a domain value in this dialog, the arrows pointing to the node will update to show how many constraints would be satisfied with that value assignment. Green arrows mean a constraint is satisfied, red arrows mean it is inconsistent for that value assignment.
You can view a plot for a search by clicking on the 'Show Plot' button. The 'Hill-Climbing Plot' window that appears plots the number of conflicts over the step count, just as the 'Trace' window shows the number of conflicts with each step.
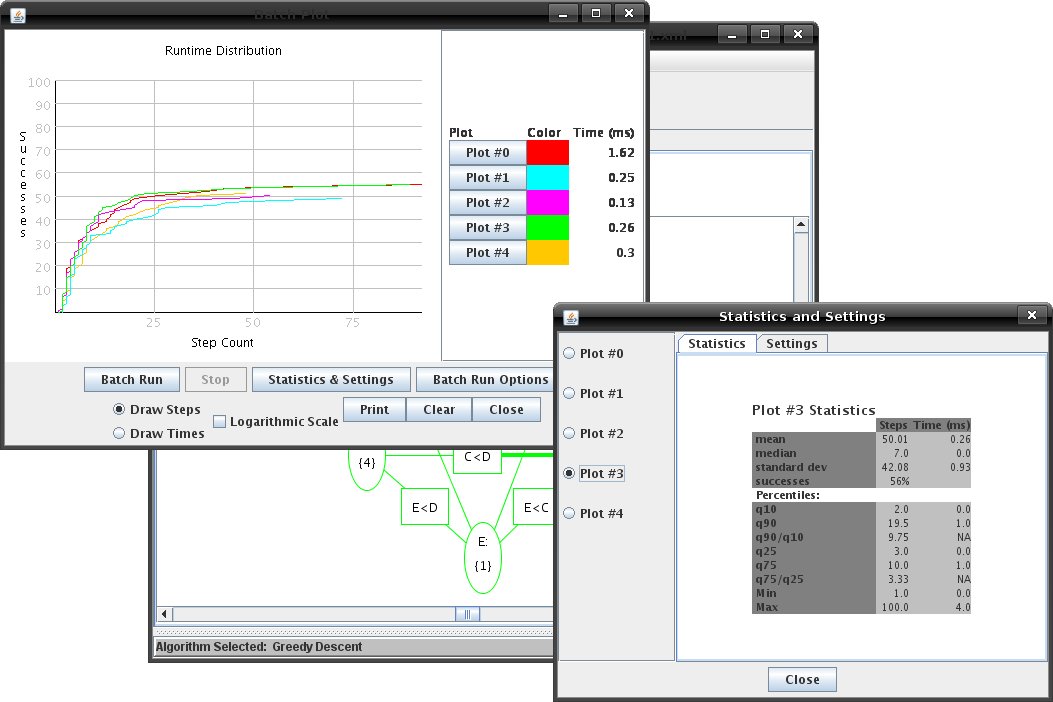
The applet also allows you to automatically run several searches, using the selected algorithm, in a batch run by clicking on the 'Batch Run' button. A runtime distribution of the batch run will appear in the 'Batch Plot' window. You can set batch run properties such as the number of trials to attempt per run, or the termination number in the 'Batch Run Options' dialog under the 'Hill Options' menu. You can also plot more than one batch run and compare their plots. To view the detailed statistics and settings of any plot, either click on the "Statistics & Settings" button, or click on the plot number of the plot you want to analyze in the legend to the right of the runtime distribution.
|
| Main Tools: Graph Searching | Consistency for CSP | SLS for CSP | Deduction | Belief and Decision Networks | Decision Trees | Neural Networks | STRIPS to CSP |